Project Overview
The Orange County Parcel Checker is a high-performance geospatial web application developed for Orange County, Florida, that visualizes and manages over 500,000 parcel records with dynamic overlays and real-time CAD integration. As the lead frontend developer at Silvacom Ltd., I built an Angular application featuring optimized data visualization, custom interactive charts, and groundbreaking AutoCAD Design Automation API integration for real-time CAD-to-web synchronization.
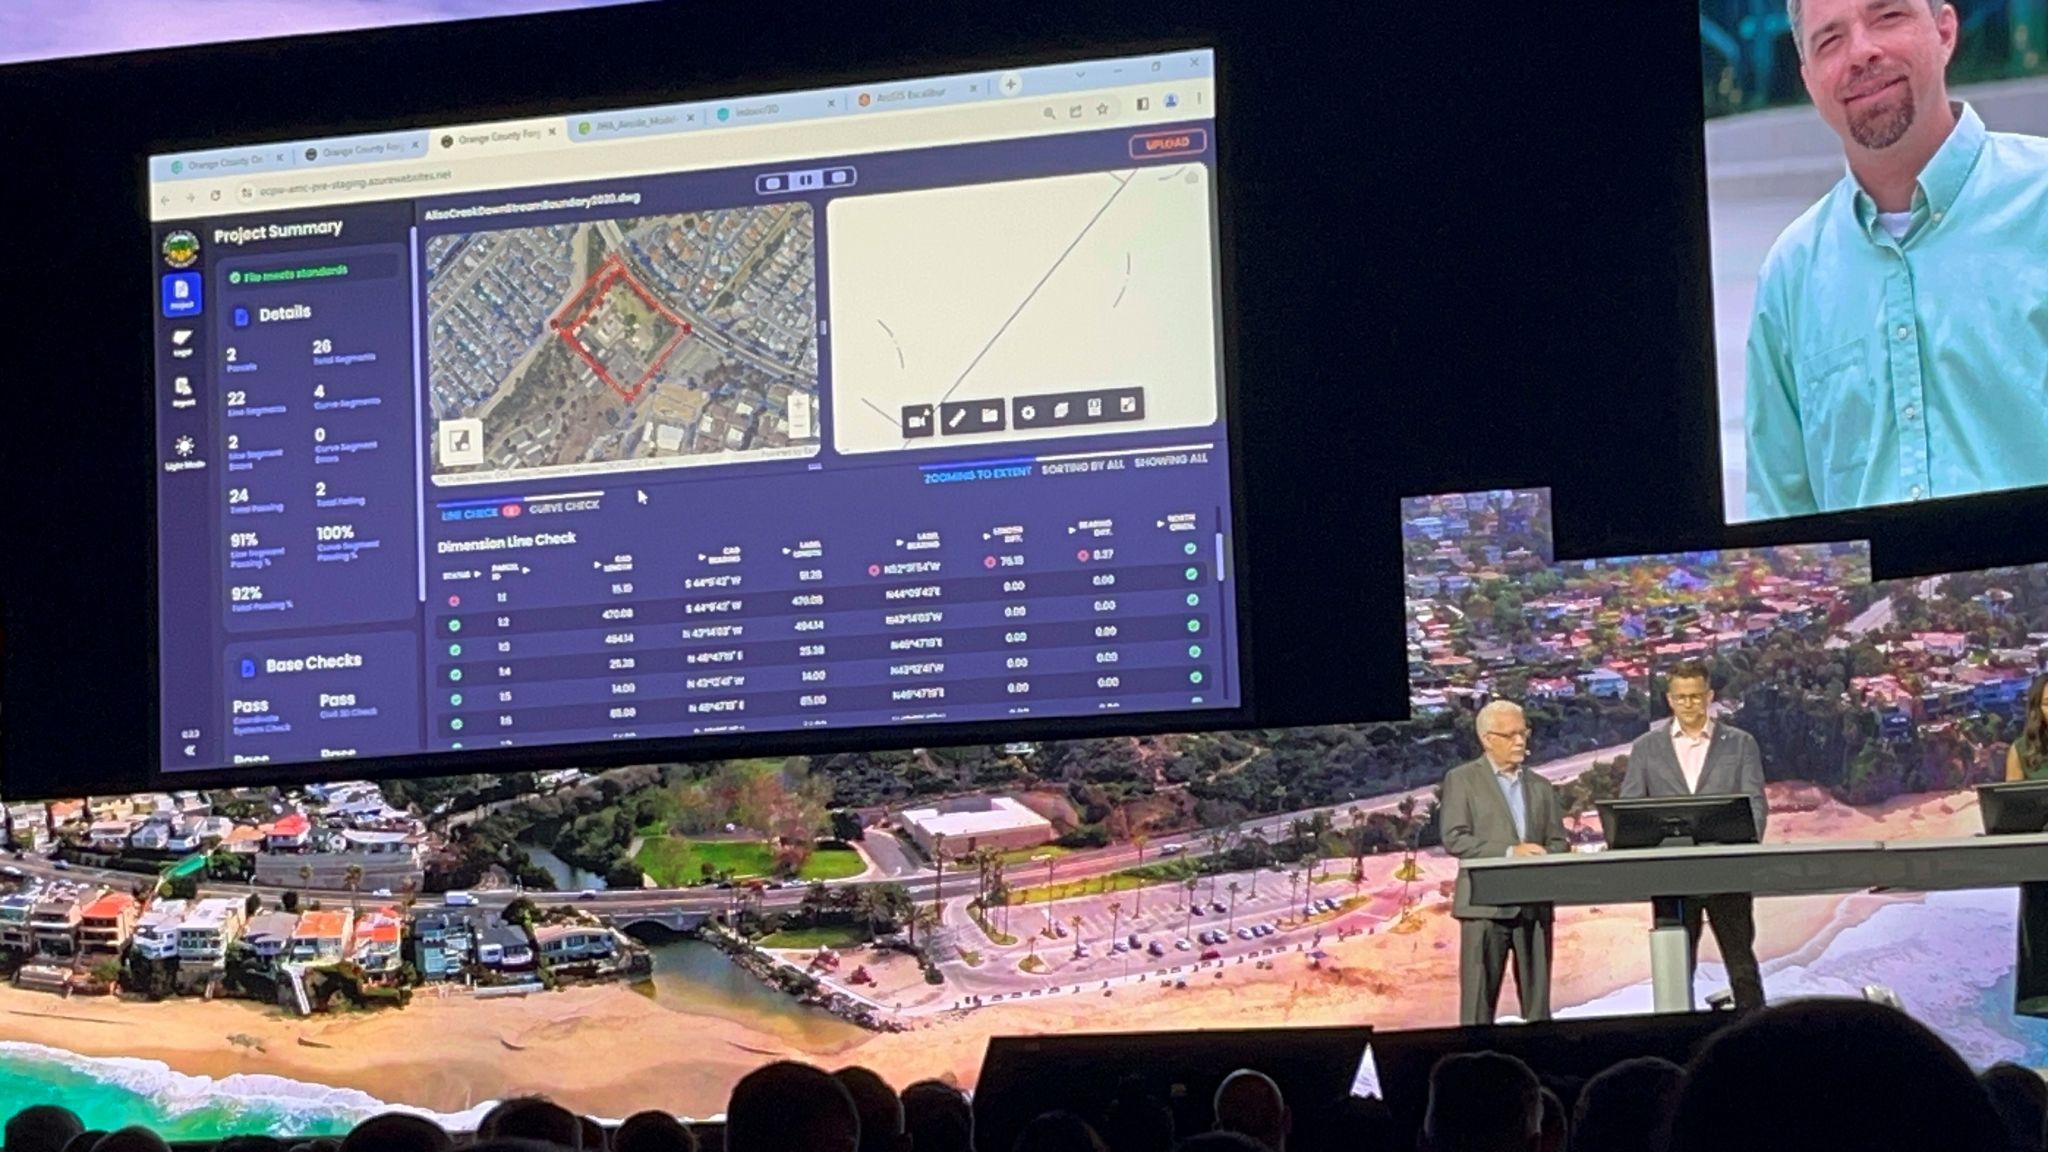
The application's innovative approach to handling massive datasets and CAD integration earned it a featured spot in the Esri User Conference plenary session, showcasing it as a cutting-edge example of modern GIS web development to thousands of attendees.
The Challenge
Orange County needed a performant web application to visualize and query over 500,000 parcel records with multiple data overlays, while also providing real-time synchronization with AutoCAD files used by surveyors and engineers. The challenge was rendering this massive dataset smoothly in a web browser while maintaining responsive interaction, and pioneering an integration with AutoCAD Design Automation API that had never been attempted at this scale.
My Solution
I architected and built a highly optimized Angular application with multiple performance and integration innovations:
- Performance-Optimized Rendering: Built custom rendering strategies using ArcGIS JS SDK with progressive loading, viewport culling, and LOD (Level of Detail) techniques to smoothly render 500,000+ parcels
- AutoCAD Integration: Pioneered integration with AutoCAD Design Automation API for real-time CAD-to-web synchronization, allowing surveyors to see CAD changes reflected instantly in the web application
- Custom Data Visualization: Developed interactive charts and tables for analyzing parcel data, zoning information, and property attributes
- Dynamic Overlays: Implemented system for toggling multiple data layers including zoning, flood zones, infrastructure, and historical data
- Advanced Query Tools: Built sophisticated search and filter capabilities for finding parcels by attributes, spatial queries, and complex boolean logic
Key Features
- 500,000+ Parcels: High-performance rendering of massive parcel datasets with smooth 60fps interactions
- AutoCAD Integration: Real-time synchronization between CAD files and web visualization using AutoCAD Design Automation API
- Interactive Data Viz: Custom charts and tables for analyzing parcel attributes, zoning, and property data
- Dynamic Overlays: Toggle between multiple data layers including zoning districts, flood zones, and infrastructure
- Advanced Search: Sophisticated query tools with spatial search, attribute filtering, and boolean logic
- Responsive Performance: Progressive loading and viewport culling for instant map interactions
Technical Implementation
The application is built with Angular and TypeScript, utilizing RxJS for reactive state management and event handling. The ArcGIS JS SDK provides the mapping foundation, but the real innovation lies in the custom performance optimizations I implemented to handle the massive dataset.
I developed custom rendering strategies including viewport-based culling (only rendering visible parcels), progressive loading (loading data in chunks as users pan), and Level of Detail (LOD) techniques that simplify geometry based on zoom level. These optimizations ensure the application maintains 60fps even when visualizing hundreds of thousands of parcels simultaneously.
The AutoCAD Design Automation API integration was particularly challenging and innovative. I built a system that monitors CAD files for changes, processes them through AutoCAD's cloud service, converts the output to web-compatible formats, and synchronizes the visualization in real-time. This allows field engineers to see their CAD updates reflected in the web application within seconds.
Data Visualization & UX
Beyond the mapping interface, I created custom data visualizations including:
- Interactive charts showing parcel distribution by zoning type
- Timeline visualizations for historical property data
- Sortable, filterable data tables with virtualization for performance
- Summary statistics dashboards with real-time updates based on selected parcels
These visualizations provide multiple ways to understand and analyze the data, making the application valuable for diverse user groups including planners, surveyors, and public officials.
Recognition & Impact
The Orange County Parcel Checker's innovative approach to handling massive datasets and its groundbreaking AutoCAD integration earned it a featured spot in the Esri User Conference plenary session. Being showcased to thousands of GIS professionals validated the technical innovations and performance optimizations that make the application exceptional.
The application successfully serves Orange County staff, surveyors, engineers, and the public, providing instant access to comprehensive parcel information with interactive visualizations. The AutoCAD integration eliminated manual data synchronization workflows, saving countless hours of work and reducing errors.
Key Takeaways
This project pushed the boundaries of web-based GIS performance and taught me advanced optimization techniques for handling massive datasets in the browser. The AutoCAD Design Automation API integration required creative problem-solving and pioneering work with an API that had limited documentation for web integration use cases.
I gained deep expertise in performance profiling, identifying bottlenecks, and implementing targeted optimizations. The experience of having my work featured at a major industry conference reinforced the value of pushing technical boundaries and sharing innovative solutions with the broader community.